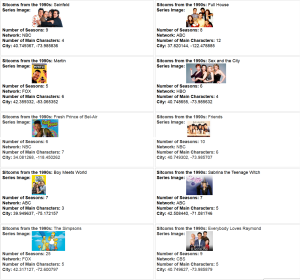
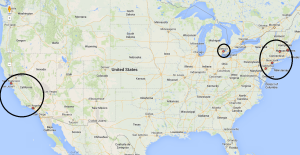
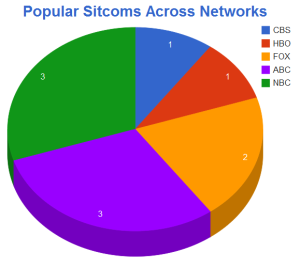
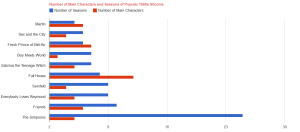
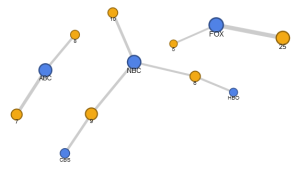
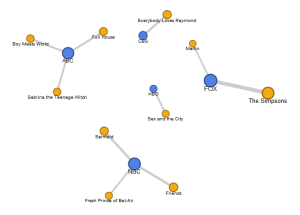
Using Google Fusion Tables, I explored commonalities between 1990s sitcoms because they all followed a similar storytelling formula. Looking at 10 shows, I mapped out the locations of the settings for each show, finding that nearly all of them took place on the east or west coasts. The pie chart reveals the number of shows per network and the bar graph shows its data points comparatively. What’s most interesting to me is the network view. The connections between broadcast/cable network and series is a more visually engaging way of sharing the information. http://wp.me/p4UATe-fk
